[Article] Random malware analysis & unpacking - Stage 1/3
Recently a friend of mine gave me some random malware samples, and I decided to analyse them and write up my finding here in order to improve my reverse engineering skills. Today, we’ll learn about : IDA Python, frida on PE, IDA structs generation, multiple packing techniques, one good old anti-dbg technique, and some win internals.
Indicators
Today we will be talking about what appears to be a generic trojan according to VirusTotal :
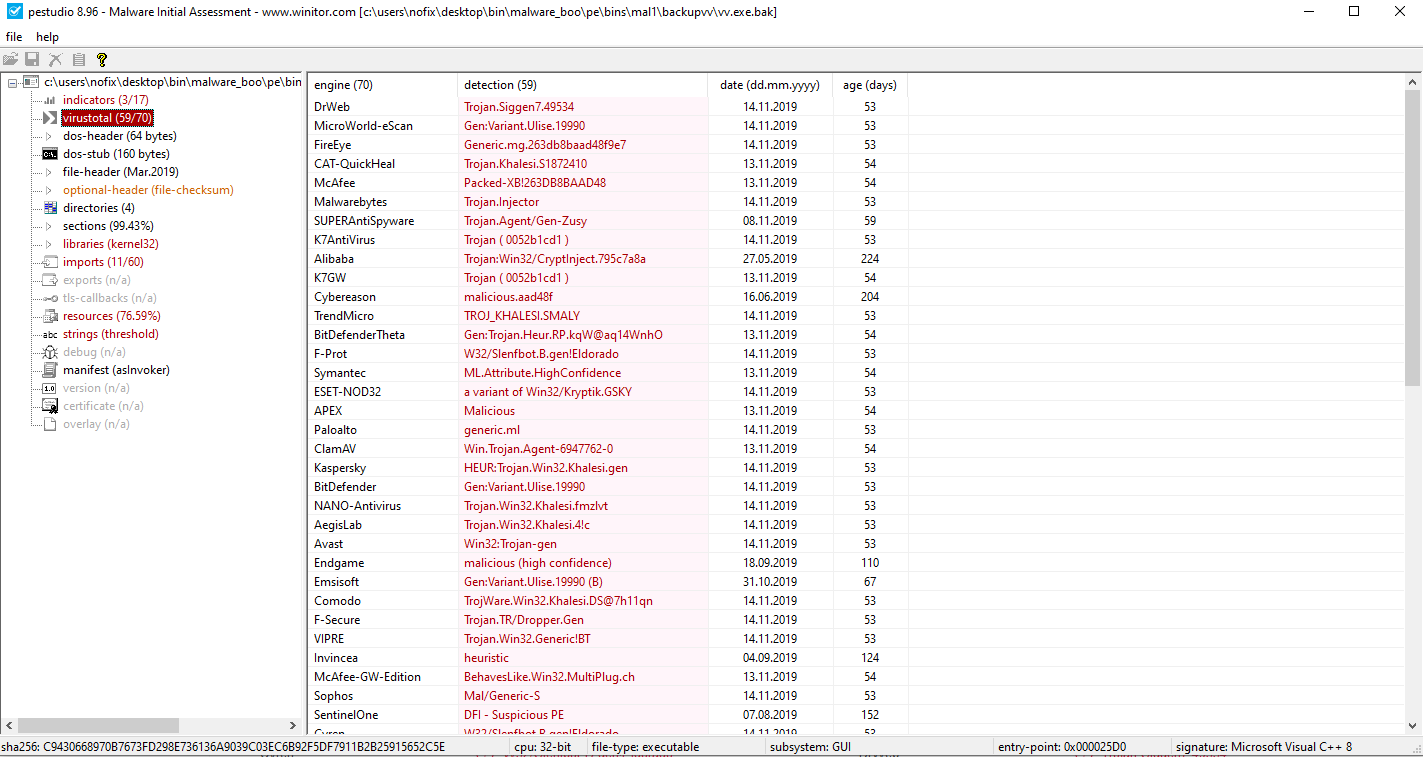
md5sum: 263db8baad48f9e7684b7e445af3fe19.
imphash : d8691188c285d2cf8265c0e15c738ffb.
As the malware is probably packed, I tried to search for its imphash online. Sadly it gave no interesting result. I could not find any trace of this binary online.
WinMain
Looking at the WinMain in hexrays gives quite a bad result :
  sub_401050();
  *(dword_40C7DC + 288) = sub_401DF0(*(dword_40C7DC + 144));
  v4 = (*(dword_40C7DC + 288))();
  *(dword_40C7DC + 416) = sub_401DF0(*(dword_40C7DC + 20));
  *(dword_40C7DC + 136) = sub_401DF0(*(dword_40C7DC + 96));
  v10 = 0;
  hHandle = (*(dword_40C7DC + 136))(&v8, 0, 0, 0);
  v7 = sub_4011A0;
  *(dword_40C7DC + 72) = sub_401DF0(*(dword_40C7DC + 128));
  (*(dword_40C7DC + 72))(&unk_40C7C0);
  *(dword_40C7DC + 360) = sub_401DF0(*(dword_40C7DC + 464));
  (*(dword_40C7DC + 360))(v7);
  *(dword_40C7DC + 420) = sub_401DF0(*(dword_40C7DC + 408));
  *(dword_40C7DC + 440) = sub_401DF0(*(dword_40C7DC + 12));
  dword_40C7E4 = (*(dword_40C7DC + 420))();
  dword_40C7D8 = 0;
  *(dword_40C7DC + 124) = sub_401DF0(*(dword_40C7DC + 444));
  *(dword_40C7DC + 108) = sub_401DF0(*(dword_40C7DC + 280));
  (*(dword_40C7DC + 108))(&v6, v4, sub_401530, &v11, 1, 20, 0);
  return (*(dword_40C7DC + 416))(hHandle, 500000);
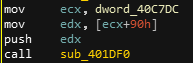
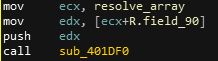
The binary looks obfuscated using a global array. Let’s dive into the disassembly. One thing we can quickly notice in the disassembly of WinMain is that the binary calls the function sub_401DF0 multiple times after pushing one offset of the global array. The global array has a pointer at 0x40c7dc pointing to the array. WinMain function also loads offset arrays and call them using calls to registers.
| Multiple calls to registers | Multiple sub calls |
|---|---|
 |
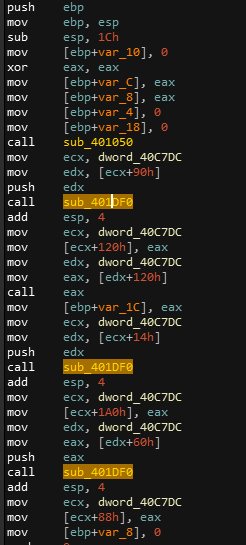 |
We can assume that sub_401DF0 is a function that will resolve some obfuscated address.
Dealing with obfuscation
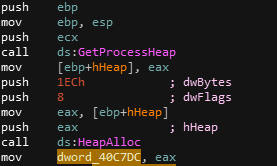
First things first, the program starts by calling the function sub_401050. Here is where is allocated our global array :
Then, the program loads multiple values into specific offsets of the array. To deal with this type of obfuscation, we could ask to IDA’s hexray to auto-generate a struct according to references to our global array in a decompiled function. We want to get something that would look like this :
struct global_resolve_array{
	field_0 dd  // the program looks like to be only storing 32 bits pointers
	field_4 dd  // so I increase four by four
	field_8 dd
	[...]
	field_XX dd
};
The main problem of this method is that as the global array is… hum, global, it will be referenced in many different functions and thus IDA will not create an appropriate structure. Digging around the program I found that the global array has 119 fields. Knowing that, we can generate the struct ourself using IDA python.
# struct name = "R"
# size = 480 bytes
# fields = 119
id = AddStrucEx(-1, "R", 0); # short name to avoid too much noise in decompilation
for i in xrange(0,480,4):
    AddStrucMember(id, "field_%x"%i, i, FF_DWRD, -1, 4);
Note we could have also have used Igor Kirillov’s struct builder plugin for IDA, but such a tool wont be useful here as the struct seems to be quite simple.
Now that we have our struct, I rename the global array (let’s name it resolve) , and retype it as a R* in the decompiler. I now also have the capability in the disassembly to resolve offsets to R.field_X, which will be much more readable.
| Before | After |
|---|---|
 |
 |
Now let’s dive in this sub_401DF0 that is called so many times.
This function looks very familiar and it’s now clear that we are facing a dynamic function resolution:
int __cdecl sub_401DF0(int arg__addr_to_resolve)
{
  _DWORD *i; // [esp+10h] [ebp-10h]
  int v3; // [esp+14h] [ebp-Ch]

  v3 = 0;
  for ( i = *(*(__readfsdword(0x30u) + 12) + 12); i[6] && !v3; i = *i )
    v3 = sub_401E80(i[6], arg__addr_to_resolve);
  return v3;
}
We notice the access to fs:30 which is the address of the PEB.
You can find a similar technique using TEB to resolve function names in my write-up of BetterDoorThanAnNT from RedPwn CTF here.
Here we loop trough imported modules (also known as dll) :
fs:30 points to the PEB described here, +12 –> points to struct _PEB_LDR_DATA* Ldr; –> +12 points to struct _LIST_ENTRY InLoadOrderModuleList;, which is basically a list of loaded dlls.
The disassembly is also quite clear :
mov     eax, large fs:30h  ; gets PEB
pop     esi
pop     edi
mov     [ebp+var_8], eax
mov     eax, [ebp+var_8]
mov     ecx, [eax+0Ch]     ; points to _PEB_LDR_DATA
mov     [ebp+var_4], ecx
mov     edx, [ebp+var_4]
mov     eax, [edx+0Ch]     ; points to module list
mov     [ebp+var_10], eax
jmp     short loc_401E36
I’ve been looking at the function called to resolve those names but it is quite, not very interesting and a waste of time as we don’t need to know how the resolve process works to resolve the names. We could have resolve the names statically if the function were not too complex but this one was quite a pain, and I lost quite some time reversing it (lesson learned : don’t reverse everything when it’s not needed).
Actually resolving functions
Frida
I still wanted to try and experiment with Frida and I have been trying many things from the documentation. For this binary, I created a script that hooks the resolve function and gives the function resolved in each call.
import frida
import sys
import atexit

pid = 0
proc_name = "vv.exe"
proc_path = "C:\\Users\\nofix\\Desktop\\bin\\MALWARE_BOO\\PE\\bins\\mal1\\vv.exe"

def proper_exit():
    try:
        print("[*] Trying to kill process before exit")
        frida.kill(pid)
        print("[+] Success")
    except:
        print("\t[-] Error trying to kill process before exit")
atexit.register(proper_exit)


def on_message(message, data):
    print("[%s] => %s" % (message, data))

def main(target_process):
    global pid
    global proc_name
    try:
        pid = frida.spawn(target_process)
        session = frida.attach(pid)
        print("\nattached\n\n")
        print("Here are all the modules loaded.")
        print([x.name for x in session.enumerate_modules()])
        script = session.create_script(
    """
    var modules = {};
    var executableName = "%s";


    function resolveAddress(addr, dllBase) {
        var idaBase = ptr(dllBase); // Enter the base address of kernel32.dll as seen in your favorite disassembler (here IDA)
        var offset = ptr(addr).sub(idaBase); // Calculate offset in memory from base address in IDA database
        var result = baseAddr.add(offset); // Add current memory base address to offset of function to monitor
        console.log('[+] New addr=' + result); // Write location of function in memory to console
        return result;
    }

    var baseAddr = Module.findBaseAddress('kernel32.dll');
    console.log('kernel32.dll baseAddr: ' + baseAddr);
    var resolve_func = "0x00401DF0";
    var resolved_symbols = new Array();

    var mainAddr = "0x004011F0";
    var MyFuncToTrace = "0x00401DF0";

    Interceptor.attach(ptr(resolve_func), {

        onEnter: function (args) {
        },

        onLeave: function (result) {

            var symbol = DebugSymbol.fromAddress(result) + "";
            symbol = symbol.replace(executableName, "").replace("!","");
            console.log(symbol);

            resolved_symbols.push(symbol.substr(11, 200));
        }
    });

    function decimalToHexString(number){
      if (number < 0){
        number = 0xFFFFFFFF + number + 1;
      }
      return number.toString(16).toUpperCase();
    }


    """ % proc_name)
        script.on('message', on_message)
        script.load()
        frida.resume(pid)
       # print("[!] Ctrl+D on UNIX, Ctrl+Z on Windows/cmd.exe to detach from instrumented program.\n\n")
        sys.stdin.read()
        session.detach()
        #frida.kill(pid)
    except Exception as e:
        print("err, killing proc")
        print(e)
        frida.kill(pid)

if __name__ == '__main__':
    if len(sys.argv) != 2:
        print(f"Usage: {__file__} <process name or PID>")
        sys.exit(1)
    try:
        target_process = int(sys.argv[1])
    except ValueError:
        target_process = sys.argv[1]
    main(target_process)
Output :
0x776e41e0 CreateTimerQueue
0x776d3e40 WaitForSingleObject
0x776d3ca0 CreateEventA
0x77cb14f0 RtlInitializeCriticalSection
0x776c9ca0 SetUnhandledExceptionFilter
0x776d3130 GetTickCount
0x776d2cb0 GetVersion
0x77c86000 RtlEnterCriticalSection
0x776e41f0 CreateTimerQueueTimer
0x776cc190 FindResourceA
0x776c52e0 LoadResource
0x776d1d90 SizeofResource
0x776d1ba0 LockResource
0x776c5ed0 VirtualAlloc
0x776d1b80 InterlockedDecrement
This gave me the resolved function names in the order they are being resolved.
Live debugging
I could also get resolved names putting a breakpoint at the end of the function to get resolved names. Once the we have resolved names, we can rename fields in the struct we created earlier in order to make our disassembly code a little bit more readable.
 It is now being quite clear that the malware resolves function names, stores them in the global array and call the function from there. In order to add even more readability to those
 call register, I used a plugin from FireEye named ApplyCalleeType. This plugin will allow us to put automatic comments on arguments pushed to resolved functions :
| Before | After |
|---|---|
 |
 |
Back to WinMain
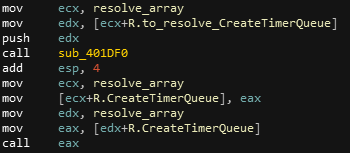
After resolving everything I needed to resolve, I get a quite easily readable output :
fill_resolve_funcs_array();
r->CreateTimerQueue = resolv(r->to_resolve_CreateTimerQueue);
timerQueue = (r->CreateTimerQueue)();
r->WaitForSingleObject = resolv(r->to_resolve_WaitForSingleObject);
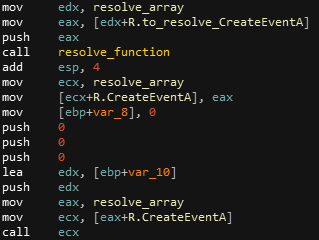
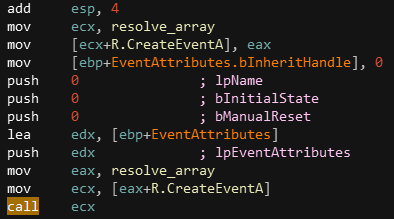
r->CreateEventA = resolv(r->to_resolve_CreateEventA);
EventAttributes.bInheritHandle = 0;
hHandle = (r->CreateEventA)(&EventAttributes, 0, 0, 0);
ptr_Exception_handler_func = TBD_Exception_handler_func;
r->RtlInitializeCriticalSection = resolv(r->to_resolve_RtlInitialieCriticalSection);
(r->RtlInitializeCriticalSection)(&RTL_CRITICAL_SEC);
r->SetUnhandledExceptionFilter = resolv(r->to_resolve_SetUnhandledExceptionFilter);
(r->SetUnhandledExceptionFilter)(ptr_Exception_handler_func);
r->GetTickCount = resolv(r->to_resolve_GetTickCount);
r->GetVersion = resolv(r->to_resolve_GetVersion);
tick_count = (r->GetTickCount)();
tick_count__ = 0;
r->RtlEnterCriticalSection = resolv(r->to_resolve_RtlEnterCriticalSection);
r->CreateTimerQueueTimer = resolv(r->to_resolve_CreateTimerQueueTimer);
(r->CreateTimerQueueTimer)(&phNewTimer, timerQueue, callBackFromMain, &Parameter, 1, 20, 0);
return (r->WaitForSingleObject)(hHandle, 0x7A120u);
Note : I had trouble finding proper arguments for the CreateTimerQueueTimer function : I was confident that official Microsoft documentation API was right about its definition, but apparently was not. I noticed that after loading the binary into OllyDBG. This tool gave me the good signature for the function. The doc states that the argument Parameter is the last argument of the function while it was the 4th. This made me lost a LOT of time when I was trying to patch arguments passed to this function later on.
The binary :
- first creates an unnamed event
- sets an unhandled exception function callback
- Saves current tick count for later use
- Enters the critical section
- Create a timer that calls
callbackFromMainevery 20ms - Wait for an event from previously created event
The callback
The callback func :
- Starts by saving the windows version for later use
- get tick count
- divide tick count with a variable initialized to 0
mov     edx, r
mov     eax, [edx+R.GetTickCount]
call    eax
mov     tick_count__, eax
mov     eax, tick_count__
xor     edx, edx
div     g_var__manual_mutex        ; div by 0
This obviously has the effect of triggering a division by 0 exception. The program is supposed to call the defined callback function in this case. An unhandled exception callback has been defined earlier, and we could except it to be called.
I called the 0 var g_var__manual_mutex because it will act like a mutex for the program. It’s a pretty poorly coded mutex.
Where is the catch?
This is a well known anti-dbg technique : UnhandledExceptions are not called if the program is currently being debugged. This technique is very well described in depth here. Go check this article if you don’t know this anti-dbg technique. The technique is also referenced in this “Ultimate” anti-dbg reference.
TR;LD : The reason to this is the check of debugger presence in the UnhandledExceptionFilter() function. This can be bypassed modifying the return value of GetCurrentProcess call from 0xFFFFFFFF to 0x00000000.
I found this call in loaded modules and put a breakpoint after it pushes the problematic value :
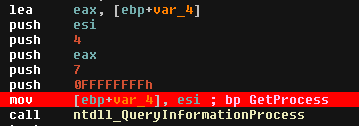
As this is executed from a DLL and generated at runtime, I wont patch the value. I will modify it while debugging.
Once then, the binary will execute the callback function:
push    ebp
mov     ebp, esp
cmp     g_var__thread_count, 0
jbe     short loc_4011D3                 ; If this is the first thread, jmp
mov     eax, nb_waiting_threads
add     eax, 1
mov     nb_waiting_threads, eax
push    0D0A0Ch
mov     ecx, hHandle
push    ecx
mov     edx, r
mov     eax, [edx+R.WaitForSingleObject]
call    eax                              ; Wait for 14mn
 loc_4011D3:                             ; CODE XREF: sub_4011A0+A↑j
mov     ecx, g_var__manual_mutex
add     ecx, 1
mov     g_var__manual_mutex, ecx
or      eax, 0FFFFFFFFh
pop     ebp
retn    4
At first thread, the function is called and g_var__manual_mutex gets incremented, which will allow a division by something != 0. callbackFromMain can then continue as expected. The main thread then increments g_var__thread_count, which will have the effect of making other created threads wait for 14mn max. It then releases the manual mutex and try to enter to a CriticalSection using RtlEnterCriticalSection(). This section will last the whole rest of the program.
Patching to get debugging working
We just need to patch the CreateTimerQueueTimer() function arguments so that the callback gets call only once, thus creating only one thread. We just need to set the timer param to 0 and set the EXEC_ONCE flag, as documented in MSDN.
A new catch, again !
Latter in the binary, there is a check on the number of created threads that prevent the binary to execute further :
  for ( i = 0; i < a2; ++i )
  {
    while ( nb_waiting_threads < var_win_version )
    {
      WaitForSingleObject(hHandle, 2 * var_win_version);
      v7 += *(i + a1);
    }
    result = sub_401AF0(*(i + a1), *(i + v6));
    *(i + a1) = result;
  }
The function waits for the number of threads to reach the windows version to continue. We need to patch this loop as well to keep our program running.
So in addition to the CreateTimerQueueTimer patch, I will patch de fault nb_waiting_threads to 100 to prevent this while loop for blocking the execution.
Self injection
Desobfuscating the rest of the program as shown above, we come to this :
v0 = GetModuleHandleA(0);
GetRessource(v0);
r->VirutalAlloc = resolv(r->field_144);
v1 = r->TBD_sizeOf_resource;
r->allocated_mem2 = (r->VirutalAlloc)();
memset(r->allocated_mem2, 0, r->TBD_sizeOf_resource);
r->b64Res = GetB64_res(r->TBD_locked_resource, r->TBD_sizeOf_resource, r->allocated_mem2, r->TBD_sizeOf_resource);
LODWORD(v2) = 32;
memcpy(&r->first32bytes, r->allocated_mem2, v2);
r->InterlockedDecrement = resolv(r->to_resolve_InterlockedDecrement);
for ( i = 0; i < r->b64Res; ++i )
  v7 += *(r->allocated_mem2 + i);
// we patched this above, it wont stop exec anymore
wrap_wait_for_threads(r->allocated_mem2 + 32, r->b64Res - 32, &r->field_17c, 5);
r->allocated_mem2 += 32;
HIDWORD(v3) = 0x3000;
LODWORD(v3) = r->TBD_size_of_allocated_mem;
r->PE_vallocated = (r->VirutalAlloc)(0, v3, 0x40u, v6);
LODWORD(v4) = r->TBD_size_of_allocated_mem;
memcpy(r->PE_base, r->allocated_mem2, v4);
r->allocated_mem2 += r->TBD_size_of_allocated_mem;
v5 = r->allocated_mem2;
JUMPOUT(__CS__, r->PE_vallocated);
The program :
- Get a resource located at the base of the binary
- Allocate a virtual space that has the size of the resource it wants to load
- Zero-ifies it
- Does a bunch of things with the resource, probably desobfuscate it
- Creates a new virtual space and copies the desobfuscated payload into it
- Probably jumps to the newly created virtual space - according to the decompilation -
Note : Although we don’t need to check precisely how the desobfuscation is done, I have been reversing quite a lot of functions to understand the process. For sake of brevity I wont be explaining it here as we don’t really care.
This technique is called Self-injection and is quite well documented on internet. Except that the decompiler is mistaking on the last part of the decompilation. Hopefully he is wrong, because jumping straigh to the MZ header would crash the program.
Notice the last instructions :
.text:0x004017B1 call    _memcpy
.text:0x004017B6 add     esp, 0Ch
.text:0x004017B9 mov     edx, r
.text:0x004017BF mov     eax, [edx+R.allocated_mem2]
.text:0x004017C5 mov     ecx, r
.text:0x004017CB add     eax, [ecx+R.size_of_allocated_mem] ; adding 0x480
.text:0x004017D1 mov     edx, r
.text:0x004017D7 mov     [edx+R.allocated_mem2], eax
.text:0x004017DD mov     eax, r
.text:0x004017E2 mov     ecx, [eax+R.image_base]
.text:0x004017E8 mov     [ebp+var_10], ecx
.text:0x004017EB mov     edx, r
.text:0x004017F1 mov     eax, [edx+R.allocated_mem2]
.text:0x004017F7 mov     [ebp+ptr_to_image_base], eax
.text:0x004017FA mov     ecx, [ebp+var_10]
.text:0x004017FD mov     edx, [ebp+ptr_to_image_base]
.text:0x00401800 push    edx
.text:0x00401800 push    edx
.text:0x00401801 push    ecx
.text:0x00401802 push    ecx
.text:0x00401803 retn
From the above disassembly, we can see that 0x480 is added to the pointer to OEP. This now points to the true entry point. If we take a look at our dump, we can notice that the famous MZ magic bytes appear at offset 0x480. This image base is pushed to the stack, along with a function. The function is pushed a last time before the retn, which pop the function’s address and jumps to it.
This function will do a process replacement that I will be detailling in my Random Malware Analysis - Stage 2/3.
Nofix -